Appearance
Subscription Report
The Subscription Report provides a clear overview of your subscription growth, helping you track new signups and compare trends over time. This dashboard is designed to give you a simple, at-a-glance look at how your subscription offerings are performing.
Accessing the Subscription Report
Go to your WordPress dashboard, then go to FluentCart > Reports in the side menu, and click on the Subscription tab.
Report Filters and Controls
The top of the dashboard gives you key controls to choose what data appears in the report.
Date Filter: This field allows you to define the date range for your report, enabling you to focus on specific periods.
Compare To: This dropdown allows you to choose a past time period to compare with your current data.
Reset Filters: Click this button to instantly clear all applied date and comparison selections and revert the report to its default view.

Subscription Chart
The main feature of this report is the Subscription Chart. It shows your growth trends by visually comparing new subscriptions across two different time periods.
- Current Range: Represented by the blue area, this shows new subscriptions for the period you selected.
- Compare Range: Represented by the green area, this shows new subscriptions for the historical period you are comparing against.
You can also use the interactive controls in the top-right corner of the chart to change the view, zoom, or download the chart as an image.

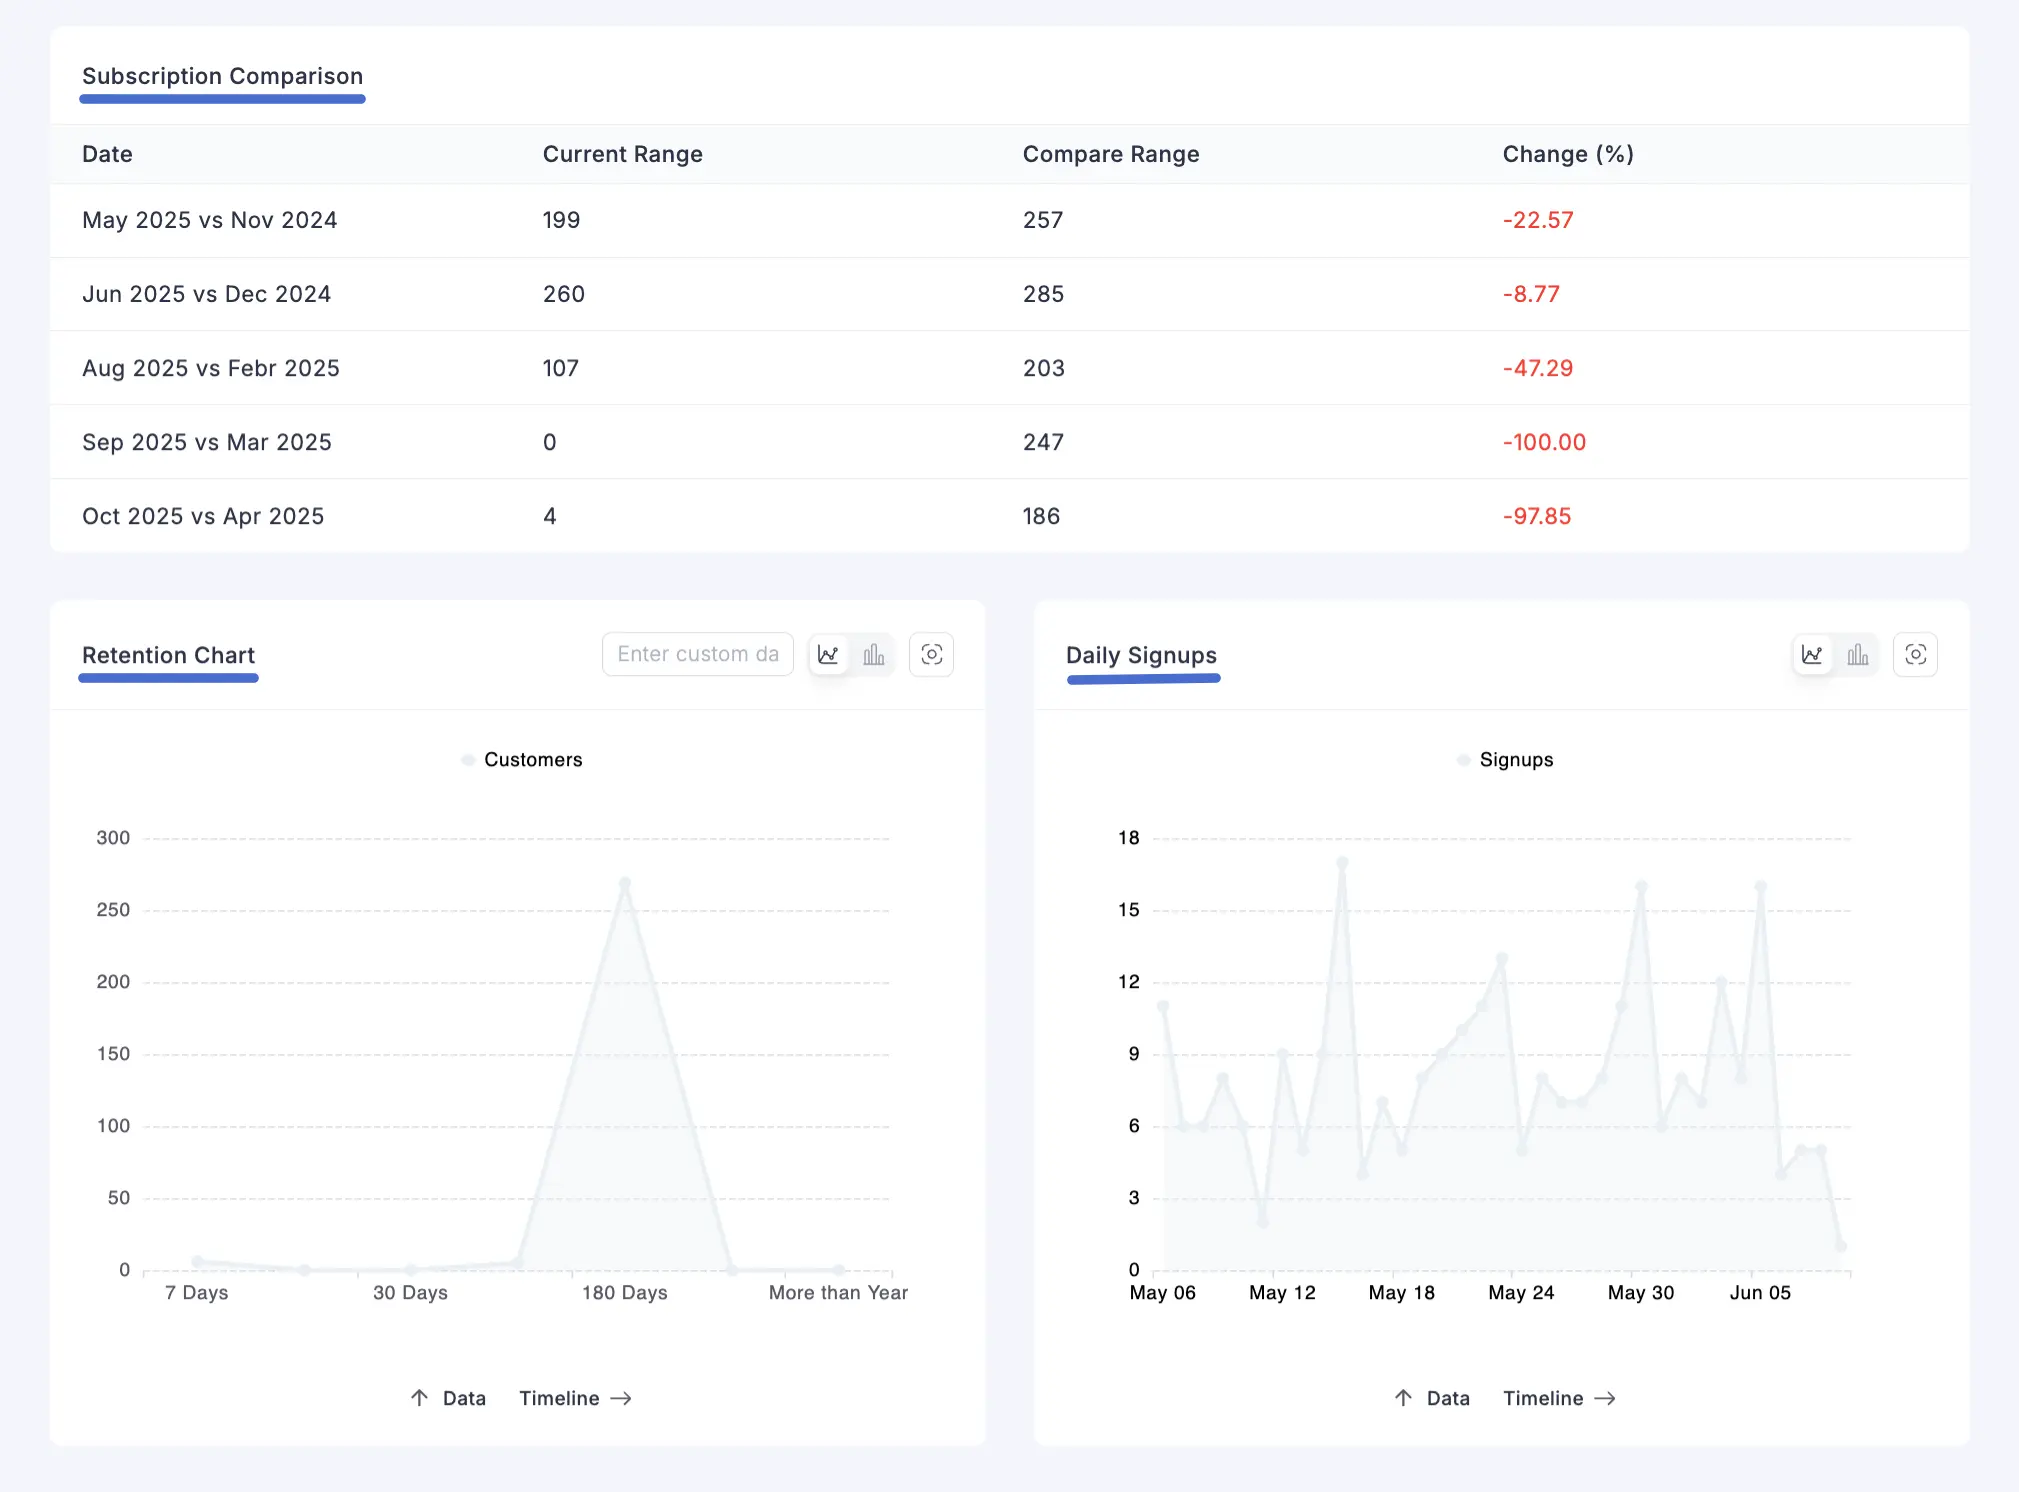
Subscription Comparison
The Comparison table provides the exact numbers from the visualization. This section is essential for seeing the precise data behind your growth trends.
- Date: This column shows the specific months being compared (e.g., "May 2025 vs April 2025").
- Current Range: This shows the total number of new subscriptions from the current month.
- Compare Range: This shows the total number of new subscriptions from the comparison month.
- Change (%): This column displays the percentage of change between the two months, color-coded for a quick view of your growth.
Detailed Subscription Analysis
Below the main comparison, you’ll find detailed charts that show customer loyalty and new customer trends. This section helps you clearly see how healthy your subscription business is.
Retention Chart: This chart shows you how long your customers stay subscribed after their initial purchase. The horizontal axis is divided into time periods like 7 Days, 30 Days, and 180 Days, making it easy to see at which point customers are most likely to drop off. This is a key tool for measuring customer loyalty.
Daily Signups: This chart tracks the number of new subscriptions you get each day. It helps you visualize your daily growth and identify trends in customer acquisition, which can be useful for seeing the impact of marketing campaigns.
With the Subscription Report, you can easily see patterns in your subscription signups, giving you the insights you need to measure your growth.