Appearance
Revenue Report
The Revenue Report in FluentCart shows a clear breakdown of your store’s earnings. You can use it to track sales over time, see where your income comes from, and check how refunds, taxes, and discounts affect your total revenue.
Accessing the Revenue Report
Go to your WordPress dashboard, then go to FluentCart > Reports in the side menu, and click on the Revenue tab.
Report Filters and Controls
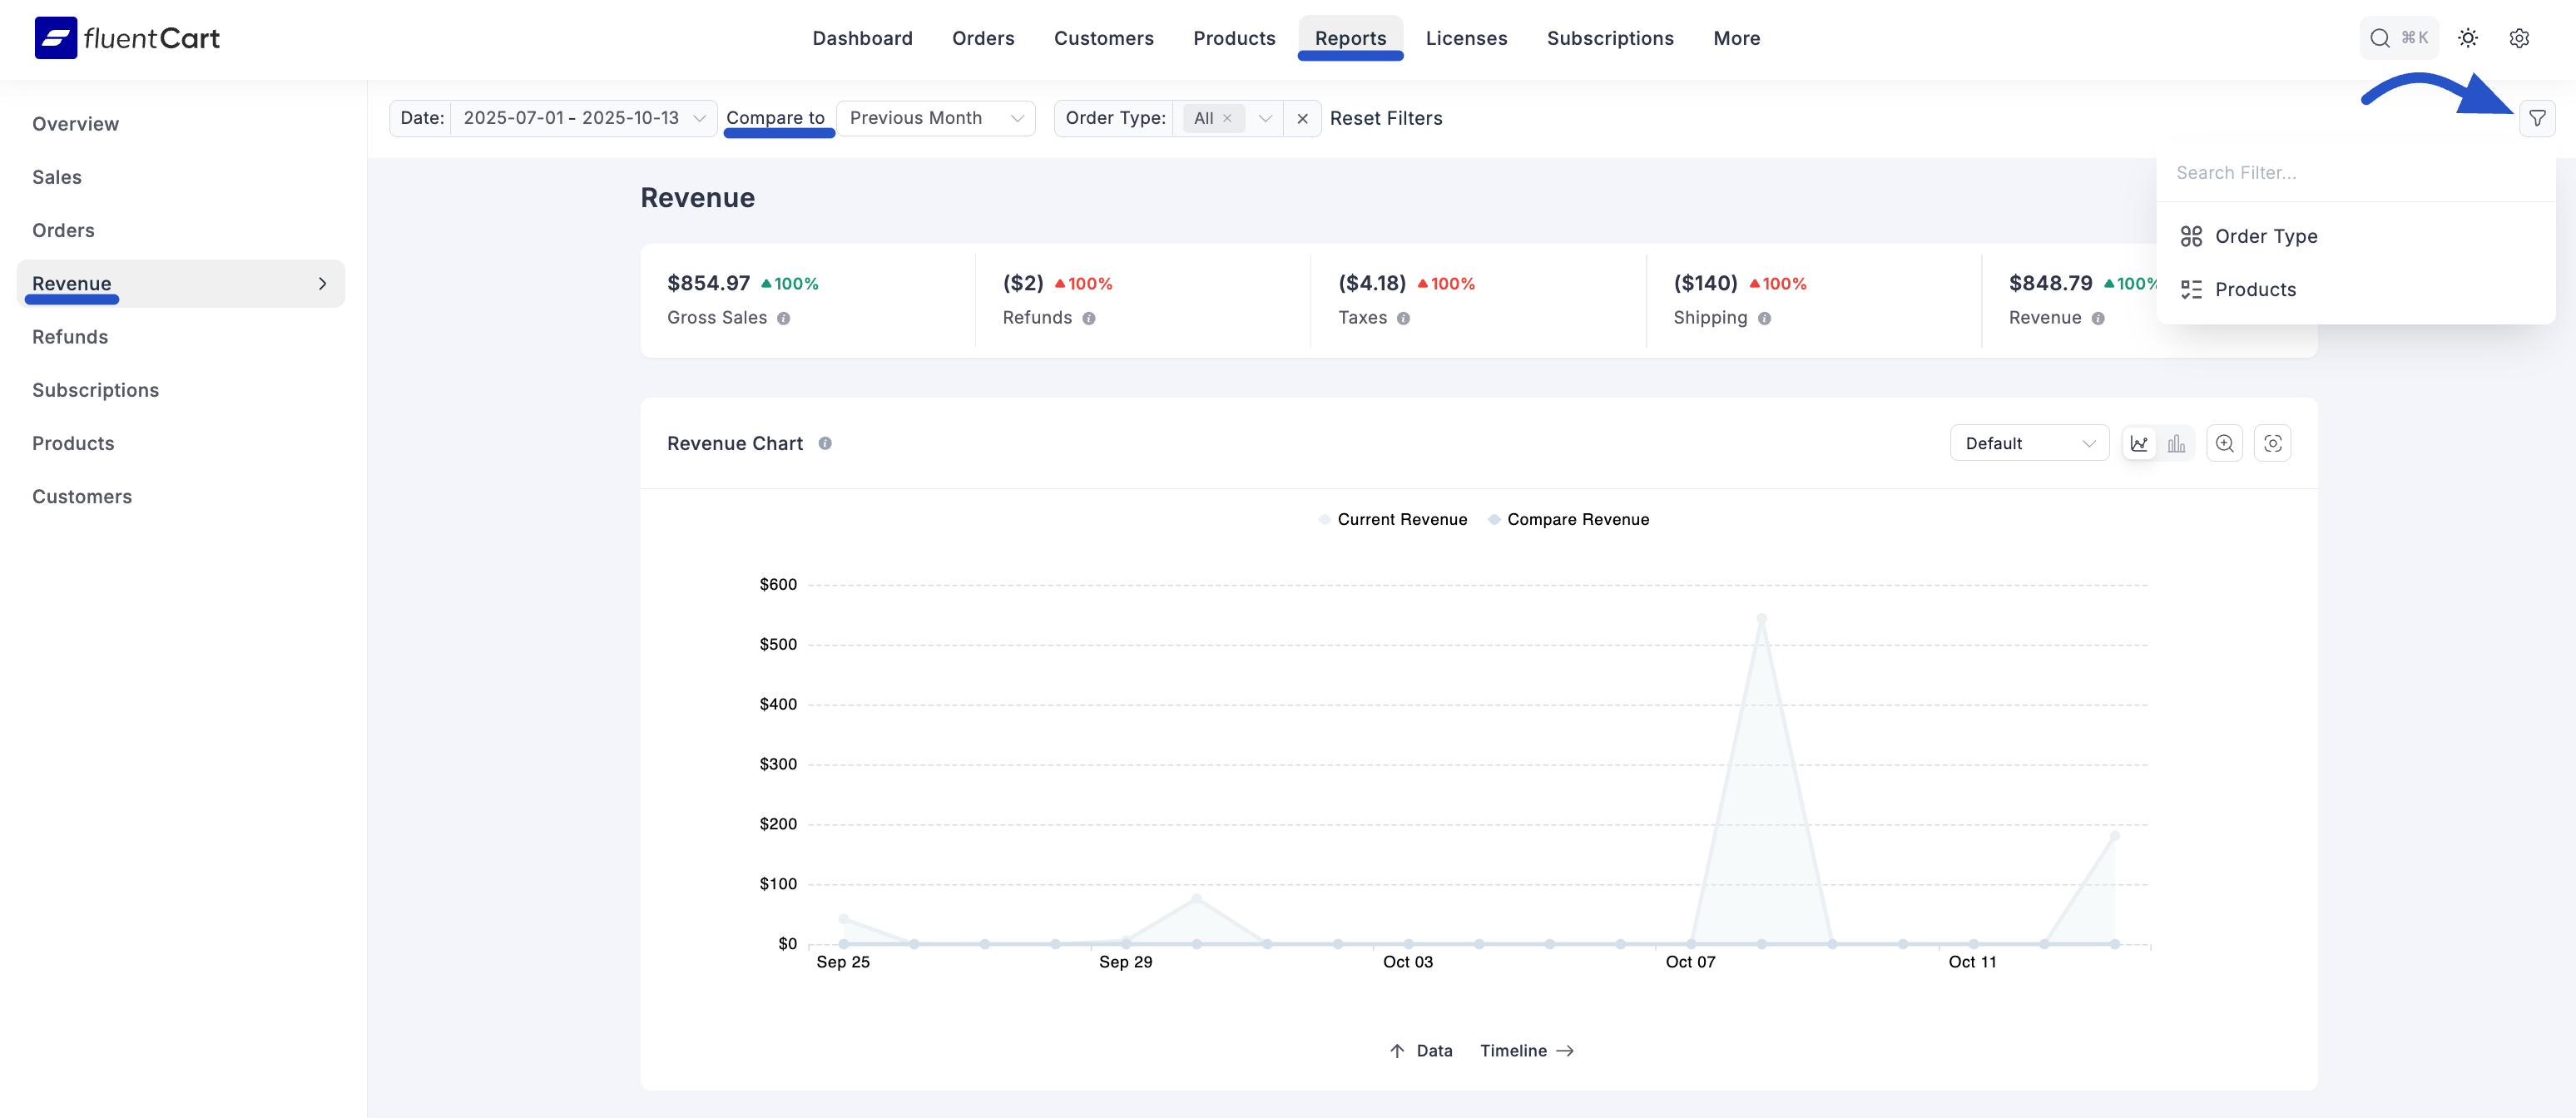
The top of the dashboard gives you key controls to choose what data appears in the report.
Date Filter: This field allows you to define the date range for your report, enabling you to focus on specific periods.
Compare To: This dropdown allows you to choose a past time period to compare with your current data.
Advanced Filters: Click the filter icon to break down the report by options like Order Type or specific Products. This helps you focus on detailed revenue data for a closer view.
Reset Filters: Click the Reset Filter button to quickly remove all selections and return the report to its original view.

Key Revenue Metrics
At the top of the report, you’ll see a quick summary of your store’s sales activity. Each number shows the total for the selected date range, along with a small visual that compares it to the period you chose in the “Compare to” filter.
- Gross Sales: This represents the total revenue from all sales before any deductions are made. The percentage and trend arrow icon (▲ or ▼) next to the value show the increase or decrease compared to the comparison period.
- Refund: This shows the total amount of money refunded. The percentage and trend arrow also show how this refund amount has changed compared to the selected period.
- Taxes: This shows the total amount collected for sales tax on orders. The percentage and trend arrow also show how this amount has changed compared to the selected period.
- Shipping: This shows the total amount collected for shipping charges on orders. The percentage and trend arrow also show how this amount has changed compared to the selected period.
- Revenue: This shows your total income after deductions like refunds have been subtracted. The percentage and trend arrow provide a direct comparison of your net revenue between the two selected periods.
Detailed Revenue Analysis
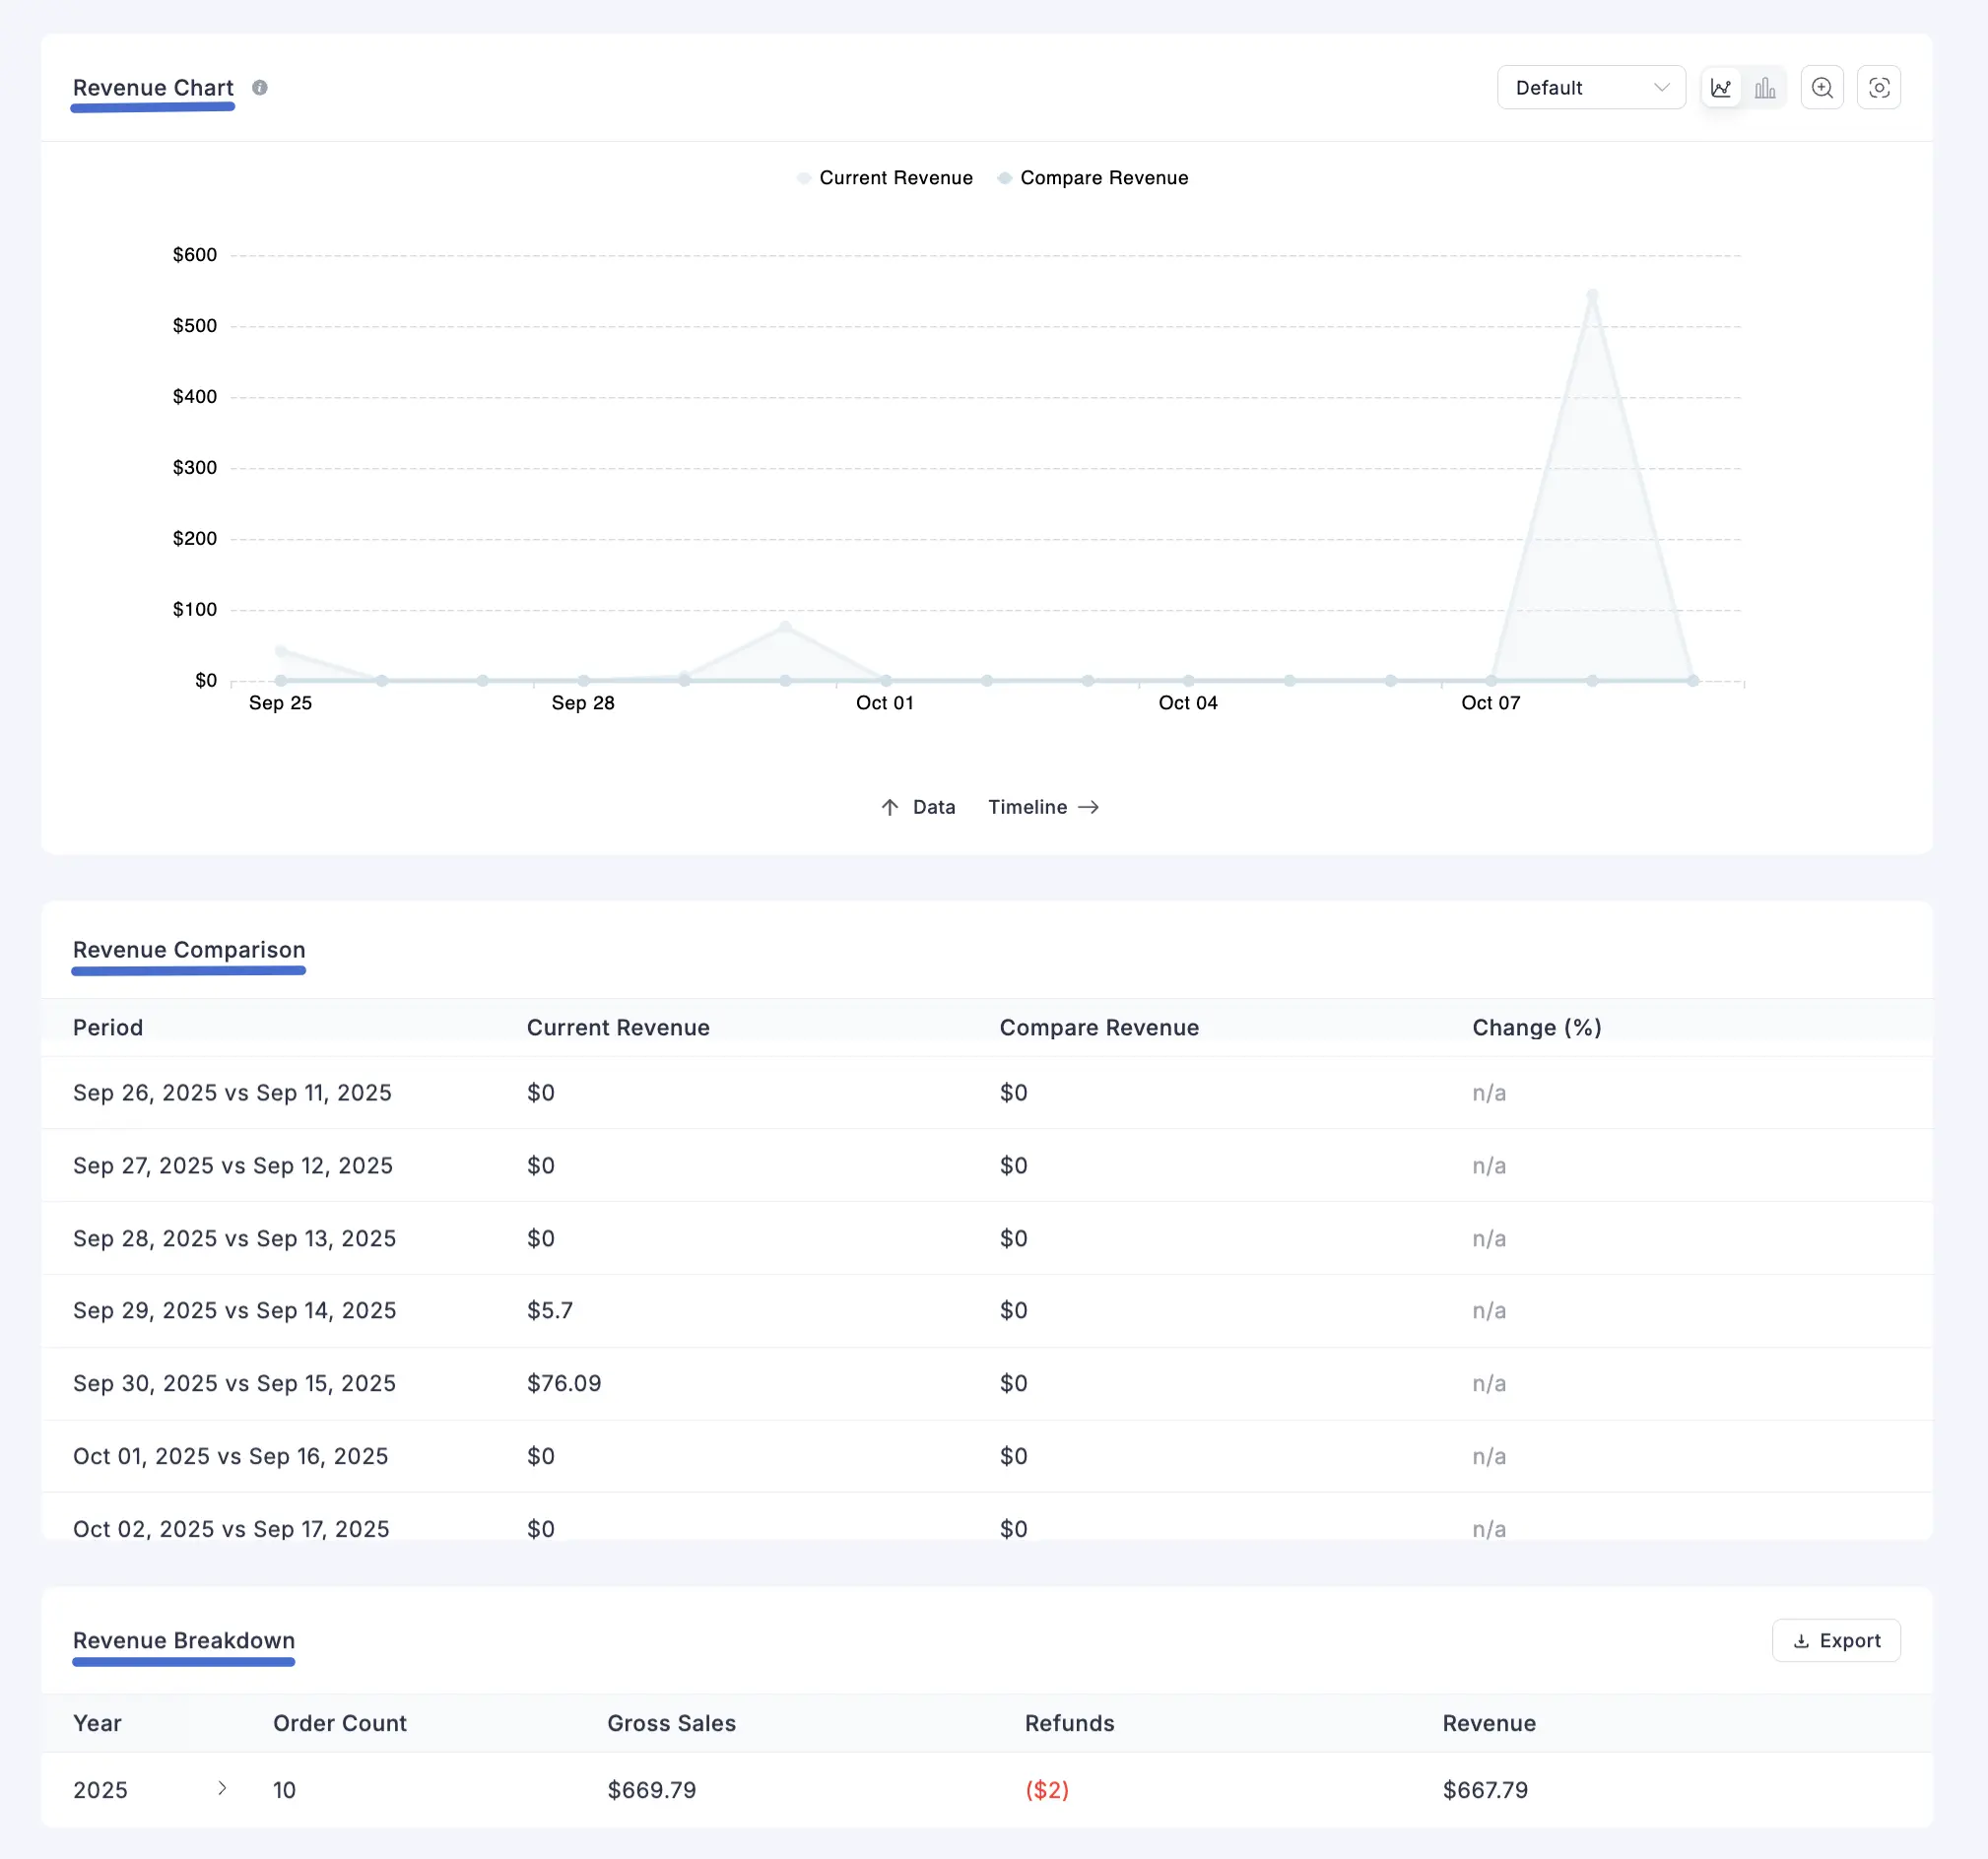
Below the key metrics, you’ll find detailed breakdowns of your store’s income. This section helps you see how well your store is performing.
- Revenue Chart: This chart shows how your earnings have changed over time, making it easy to compare income from two different periods.
- Revenue Comparison: This table provides the exact numbers from the chart, showing a period-by-period breakdown of your revenue and the percentage change.
- Revenue Breakdown: This table gives a yearly summary of your store, showing total orders, sales, refunds, and final revenue.
The Revenue Report shows how your store is earning over time. You can easily see what’s working, understand your store’s earnings, and plan to make it grow.

Net Revenue Grouped By
This section allows you to break down revenue by different criteria, making it easier to see what drives your store’s income.
Grouping Options: Use the dropdown menu on the right to choose how you want to group the data. Common options include:
- Billing Country: Shows your revenue by the customer's billing country, so you can see which countries bring in the most money.
- Shipping Country: Shows your revenue for each shipping destination.
- Payment Method: Shows revenue by payment type (like Stripe or PayPal) so you can see which options your customers use most.
Data Table: The table will dynamically update to show a detailed breakdown of your revenue based on the selected grouping, including metrics like Order Count, Gross Sales, and Net Revenue for each item in the group (e.g., for each country or payment method).
Export: Click the Export button to download the currently displayed grouped data as a CSV file.

