Appearance
Reports Dashboard Overview
FluentCart Pro’s Reports section is your built-in Business Analytics command center. It provides detailed, real-time data visualizations designed to help you understand your store's financial performance, customer behavior, and product success without the need for complex external tools.
This powerful reporting suite allows you to:
- Track Profitability: Get instant comparisons of Gross Sales versus Net Revenue and monitor your Refund Rate.
- Analyze Growth: Track changes in your Customer Base, identify Subscription trends, and calculate Customer Lifetime Value (CLTV).
- Optimize Operations: Use the Order Heatmap to identify peak sales hours and analyze the speed of your refund process.
- Pinpoint Performance: See detailed breakdowns by Product, Variant, and Country to know exactly what is selling best and where.
You can access the full reporting suite by navigating to FluentCart Pro > Reports in your top menu bar.
360-Degree View: The Full Report Section
The reporting hub is divided into several focused tabs, giving you a comprehensive view of every key area of your e-commerce operation:
- Overview: Your instant dashboard summary for high-level financial health and growth comparisons.
- Sales: Tracks volume, revenue, and identifies your top-performing products and product variants.
- Orders: Focuses on transaction count, order value, and features a Sales Heatmap to show peak ordering times.
- Revenue: Delivers the true income earned after deductions, with trend charts and geographical (per-country) breakdowns.
- Refunds: Provides detailed metrics on returns, the total refunded amount, and the time it takes to process a refund.
- Subscription: Essential for recurring sales, tracking subscriber growth, and analyzing customer retention.
- Product: Analyzes individual item performance, units sold, and provides side-by-side product comparisons.
- Customer: Monitors your store’s customer acquisition and growth, helping you understand long-term customer value.
Reports Dashboard Overview (The Summary Page)
When you first enter the Reports section, you land on the Overview tab. This tab is your main summary page, built to give you the most important information about your store's status and momentum instantly.
Reporting Overview - Gross Summary
At the very top, you get a direct summary of your store's financial volume and growth:
Gross Volume: The total sales amount before anything is taken out, charted over specific periods (e.g., quarterly or monthly).
Year-over-Year Growth (YoY): This figure shows the percentage change in your gross volume compared to the same time last year, giving you crucial context on expansion.

Key Performance Trends
The middle section presents key visual trends that inform your business strategy:
- Gross Volume Breakdown: Charts showing the historical trend of your raw sales, helping you spot seasonal patterns and monitor the overall flow of revenue.
- Stock Trend Overview: This essential graph tracks sales performance against your current inventory levels. It helps you quickly identify your fastest-moving stock and prevent potential shortages.
Core Revenue and Geographic Metrics
These sections move beyond raw sales to show real profitability and market performance:
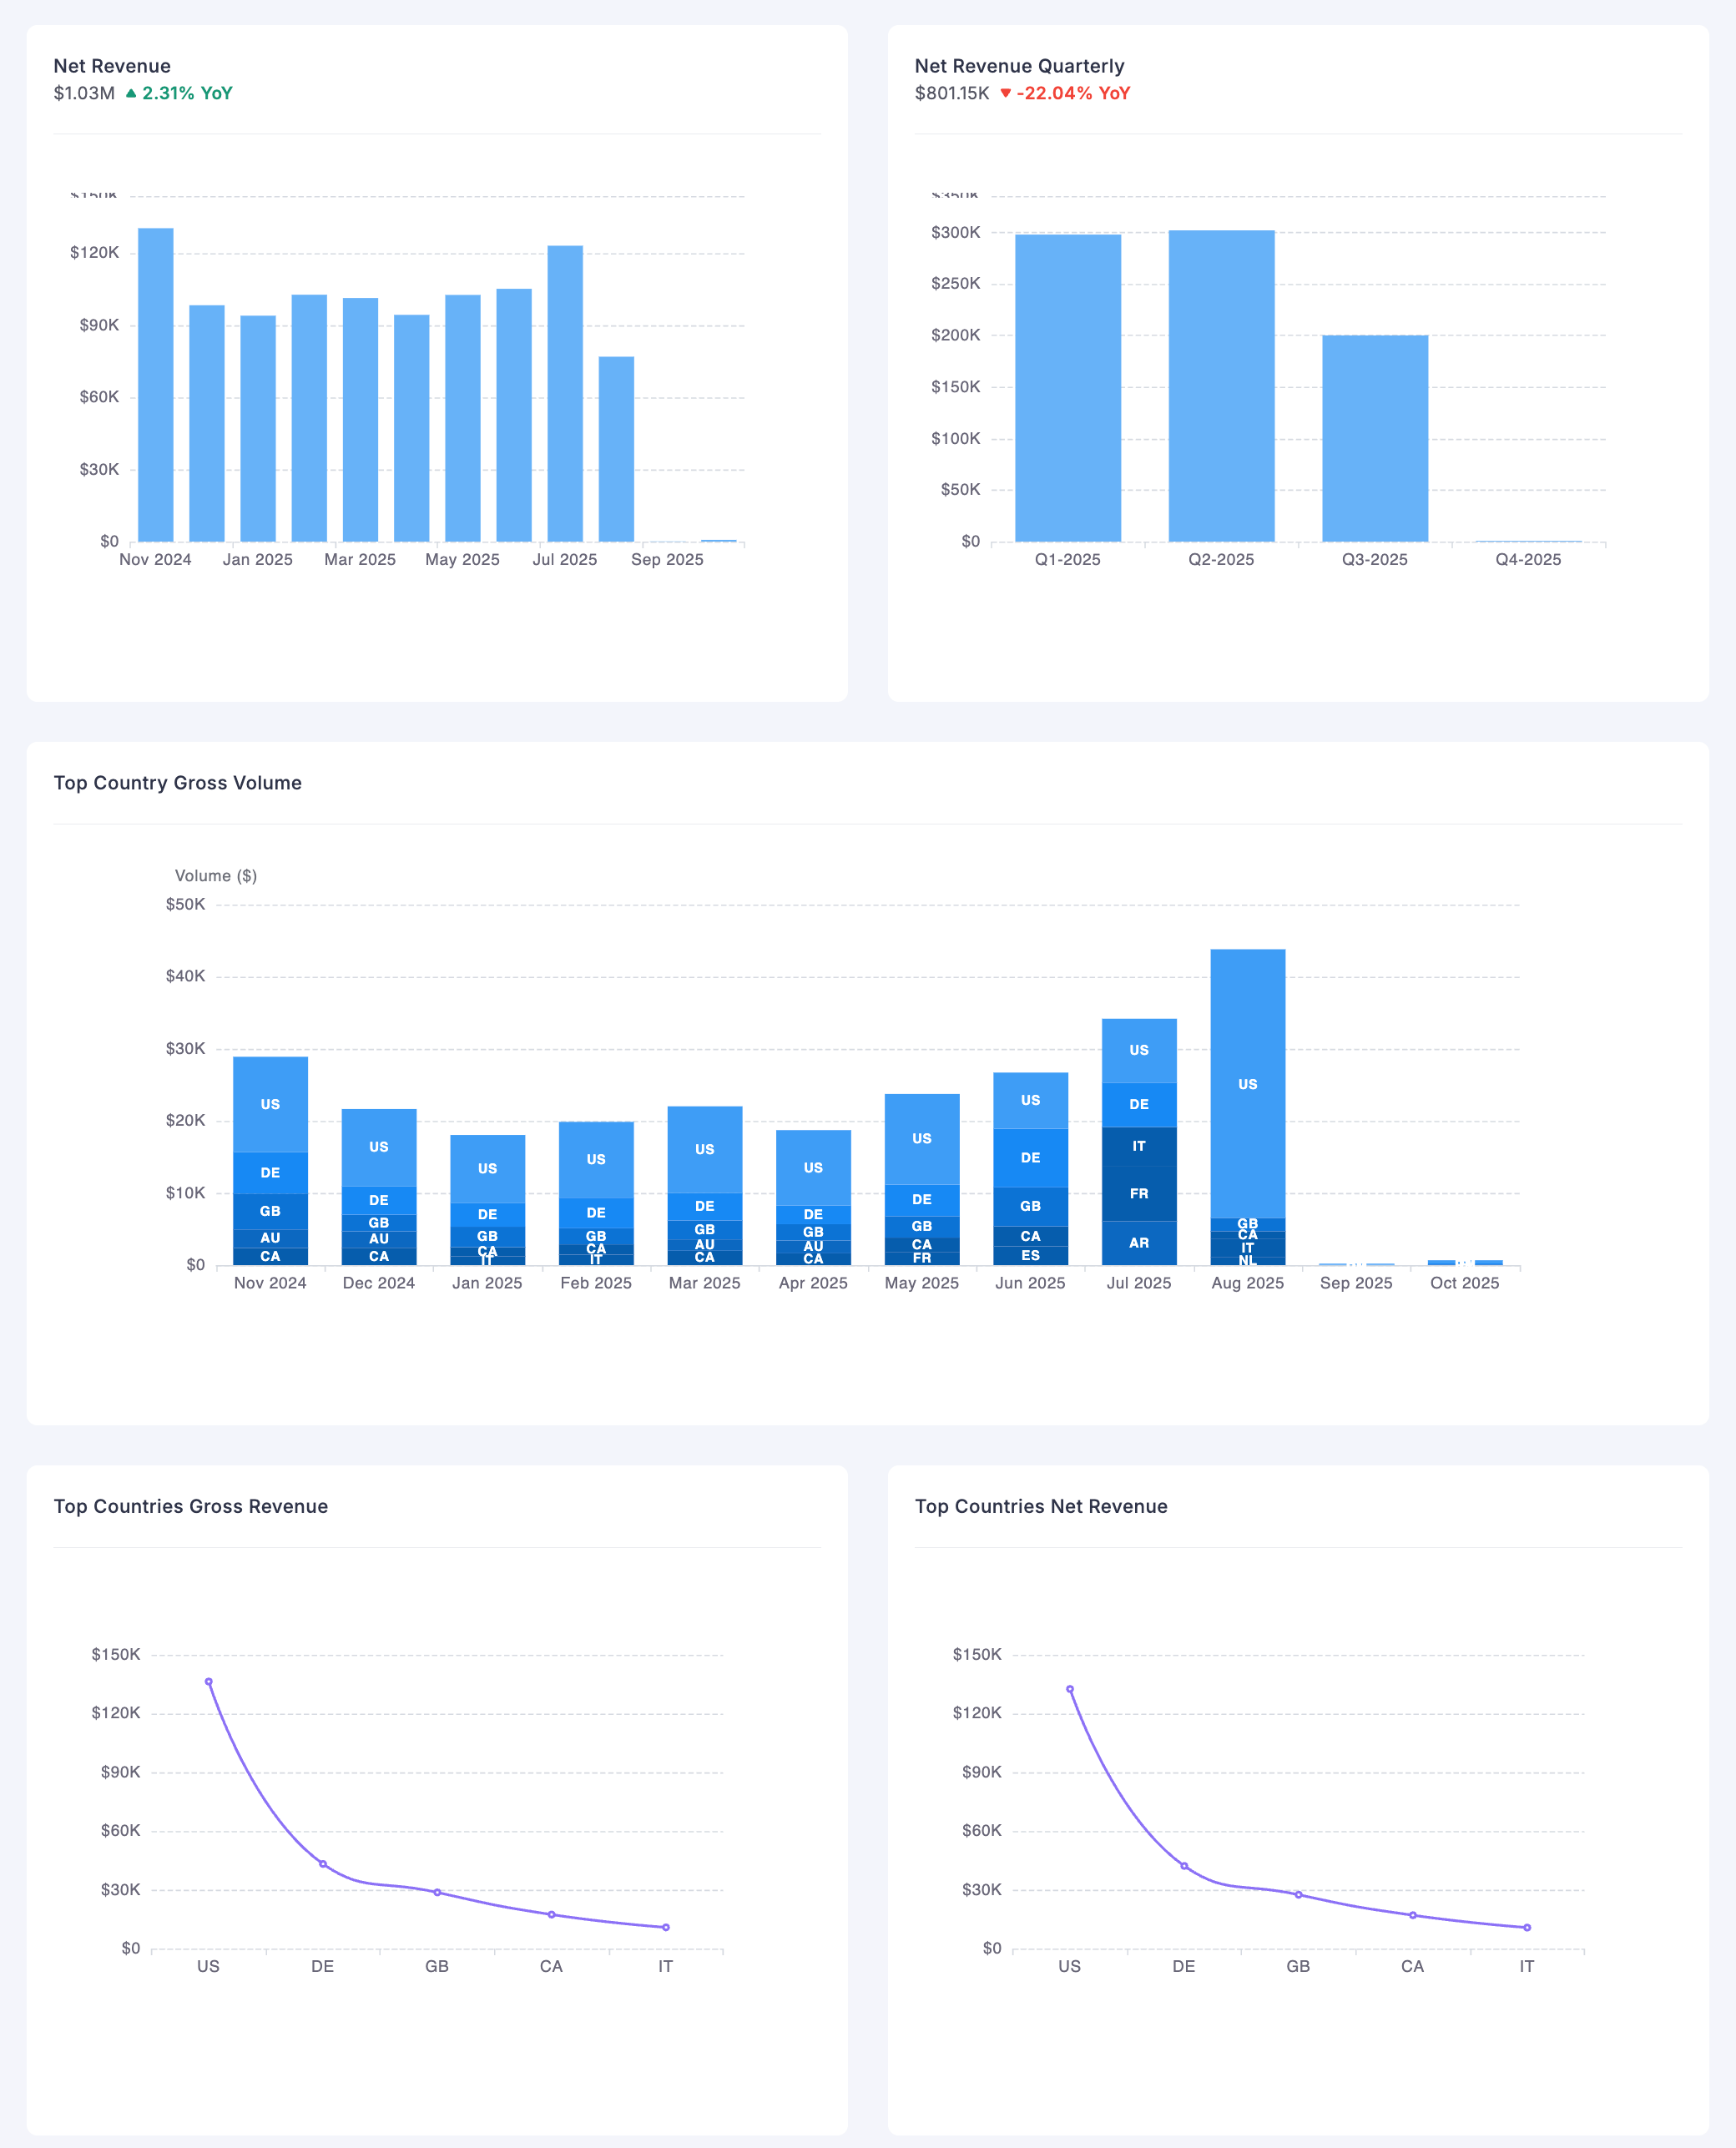
- Net Revenue: Your true total income after all costs, refunds, and discounts have been removed. This figure shows the store’s actual profitability.
- Net Revenue Quarterly: The net income broken down by three-month periods for easier fiscal review.
- Top Country Gross/Net Volume: Visual charts that categorize your sales and revenue based on the customer’s billing country. This helps you identify your most valuable geographical markets.
Product and Customer Value
The final charts focus on catalog performance and the health of your customer base:
- Top Product Sales Distribution: Graphs detailing how sales volume is distributed across your entire catalog, helping you see which products are driving the most volume.
- Customer LifeTime Value (CLTV): Metrics showing the expected total revenue from a customer over their entire relationship with your store, which is key for marketing decisions.
By reviewing the Overview first, you get a clean summary of the most critical numbers, allowing you to choose which detailed tab (Sales, Refunds, etc.) you need to investigate further.